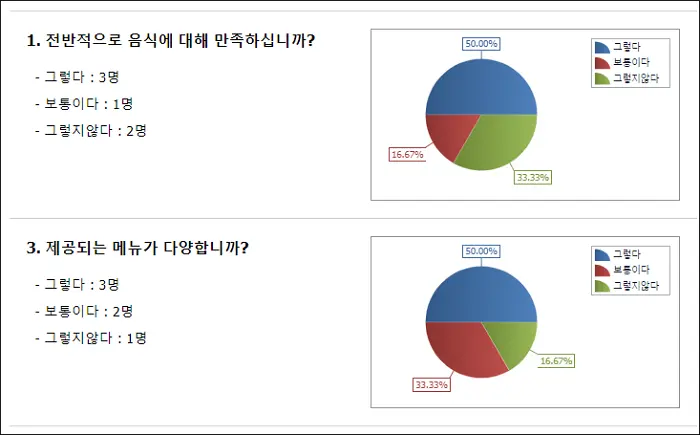
DevExpress의 WebChartControl은 웹 페이지에 차트를 쉽게 구현할 수 있도록 제공하는 차트 컨트롤입니다.
프로그램에서 Series를 직접 선언해서 구현하는 방법에 대한 설명입니다.
이번 글에서는 ASP.NET DevExpress WebChartControl 사용 방법 2가지에 대해 알아보겠습니다.

C# List를 사용하여 WebChartControl 구현
▶ 첫 번째 방법은 List 형태로 데이터를 만든 다음 Series에 DataSouce로 바인딩 하는 방법입니다.
1. List를 구현할 클래스를 먼저 선언해 줍니다. 예제에서는 PollInfo라는 이름으로 클래스를 만들었습니다.
2. List에 차트로 표시할 범례를 추가해 주면 됩니다.
3. arg가 Series point의 Argument이고, val이 Series point의 Value 입니다.
public class PollInfo { public PollInfo(string arg, decimal val) { this.arg= arg; this.val= val; } private string arg; public string Arg { get { return arg; } set { arg= value; } } private decimal val; public decimal Val { get { return val; } set { val= value; } } } //WebChartControl 구현 Series series1 = new Series(“Series1”, ViewType.Pie); List<PollInfo> list = new List<PollInfo>(); list.Add(new PollInfo(“좋다”, 3)); list.Add(new PollInfo(“보통이다”, 1)); list.Add(new PollInfo(“나쁘다”, 2)); series1.ArgumentScaleType = ScaleType.Qualitative; series1.ValueScaleType = ScaleType.Numerical; series1.ArgumentDataMember = “Arg”; series1.ValueDataMembers[0] = “Val”; series1.LegendTextPattern = “{A}”; series1.DataSource = list; WebChartControl1.Series.Add(series1); |
C# Series AddPoint를 사용하여 WebChartControl 구현
▶ 두 번째 방법은 Series의 속성 중에 Points.AddPoint 매서드를 사용하여 구현하는 방법입니다.
1. 필요한 만큼 AddPoint로 차트에 표시할 범례를 추가하면 됩니다.
2. AddPoint의 첫 번째 인수는 Series point의 Argument 입니다.
3. AddPoint의 두 번째 인수는 Series point의 Value 입니다.
4. 범례 패턴은 Argument만 표시되도록 하였습니다. (series1.LegendTextPattern = “{A}”;)
//WebChartControl 구현 Series series1 = new Series(“Series1”, ViewType.Pie); series1.Points.AddPoint(“그렇다”, 3); series1.Points.AddPoint(“보통이다”, 2); series1.Points.AddPoint(“그렇지않다”, 1); series1.LegendTextPattern = “{A}”; WebChartControl2.Series.Add(series1); |
WebChartControl Series의 LegendTextPattern 설명
WebChartControl Series의 범례 표시는 LegendTextPattern에 따라 다양하게 표현이 가능합니다.
▼ 대표적으로 많이 사용하는 범례의 패턴은 아래와 같습니다.
- {S} – Series의 이름을 표시합니다.
- {A} – Series의 Point Argument를 표시합니다.
- {V} – Series의 Point Values를 표시합니다.
- {VP} – Series의 Point Values를 퍼센트(%)로 표시합니다.
- 여러 개의 패턴을 조합해서 사용이 가능합니다.
▼ 패턴 예제 입니다.
- series1.LegendTextPattern = “{A}”; – Series point argument 표시
예: 그렇다, 보통이다, 그렇지않다. - series1.LegendTextPattern = “{S} – {A}”; – 시리즈 이름(Series.Name)과 인수(Argument) 함께 표시
예: Series1 – 그렇다, Series1 – 보통이다, Seriese1 – 그렇지않다 - series1.LegendTextPattern = “{A}:{V}”; – 시리즈 인수(Argument)와 값(Values)을 함계 표시
예: 그렇다:3, 보통이다:2, 그렇지않다:1 - series1.LegendTextPattern = “{A}:{VP:F2}”; – 시리즈 인수와 값의 퍼센트를 소숫점 2자리로 함계 표시
예: 그렇다:50.00, 보통이다:33.33, 그렇지않다:16.67
LegendTextPattern에 대해 좀 더 자세한 설명은 DevExpress의 아래 사이트를 참고하세요
https://docs.devexpress.com/CoreLibraries/DevExpress.XtraCharts.SeriesBase.LegendTextPattern
마무리
웹 사이트에서 차트를 구현하는 것이 결코 쉬운 작업은 아닙니다.
하지만 DevExpress의 WebChartControl을 사용하면 정말 쉽게 구현이 가능합니다.
ASP.NET(.aspx) 페이지의 적당한 위치에 WebChartControl을 배치하고 본문에서 설명한 방법으로 간단하게 차트를 구현할 수 있습니다.
예제에서는 파이(ViewType.Pie) 차트를 표시했지만 Bar 형태나 선형 형태의 다양한 차트를 구현할 수 있습니다.
뿐만 아니라 Series를 여러 개 선언해서 하나의 차트에 여러 형태의 차트도 구현이 가능합니다.
※ 함께 읽으면 도움이 될 만한 다른 포스팅 글입니다.
♥ 이 글이 도움이 되었기를 바랍니다. ^-^
댓글로 흔적을 남겨 주세요.